Project Details: How Prana Air partnered with IIT Roorkee’s Civil Engineering Dept. to track transport pollution in Delhi?
- Project Name: “IIT Roorkee Partners with Prana Air to Map Real-Time PM2.5 Exposure Across Delhi’s Transportation Network”
- Client: Department of Civil Engineering, IIT Roorkee, Dr Amit Agarwal and His Student Vikram Singh
- Location: Delhi, India
- Application: 25 Ambient PM, Air Quality Monitoring across various public and private transport modes
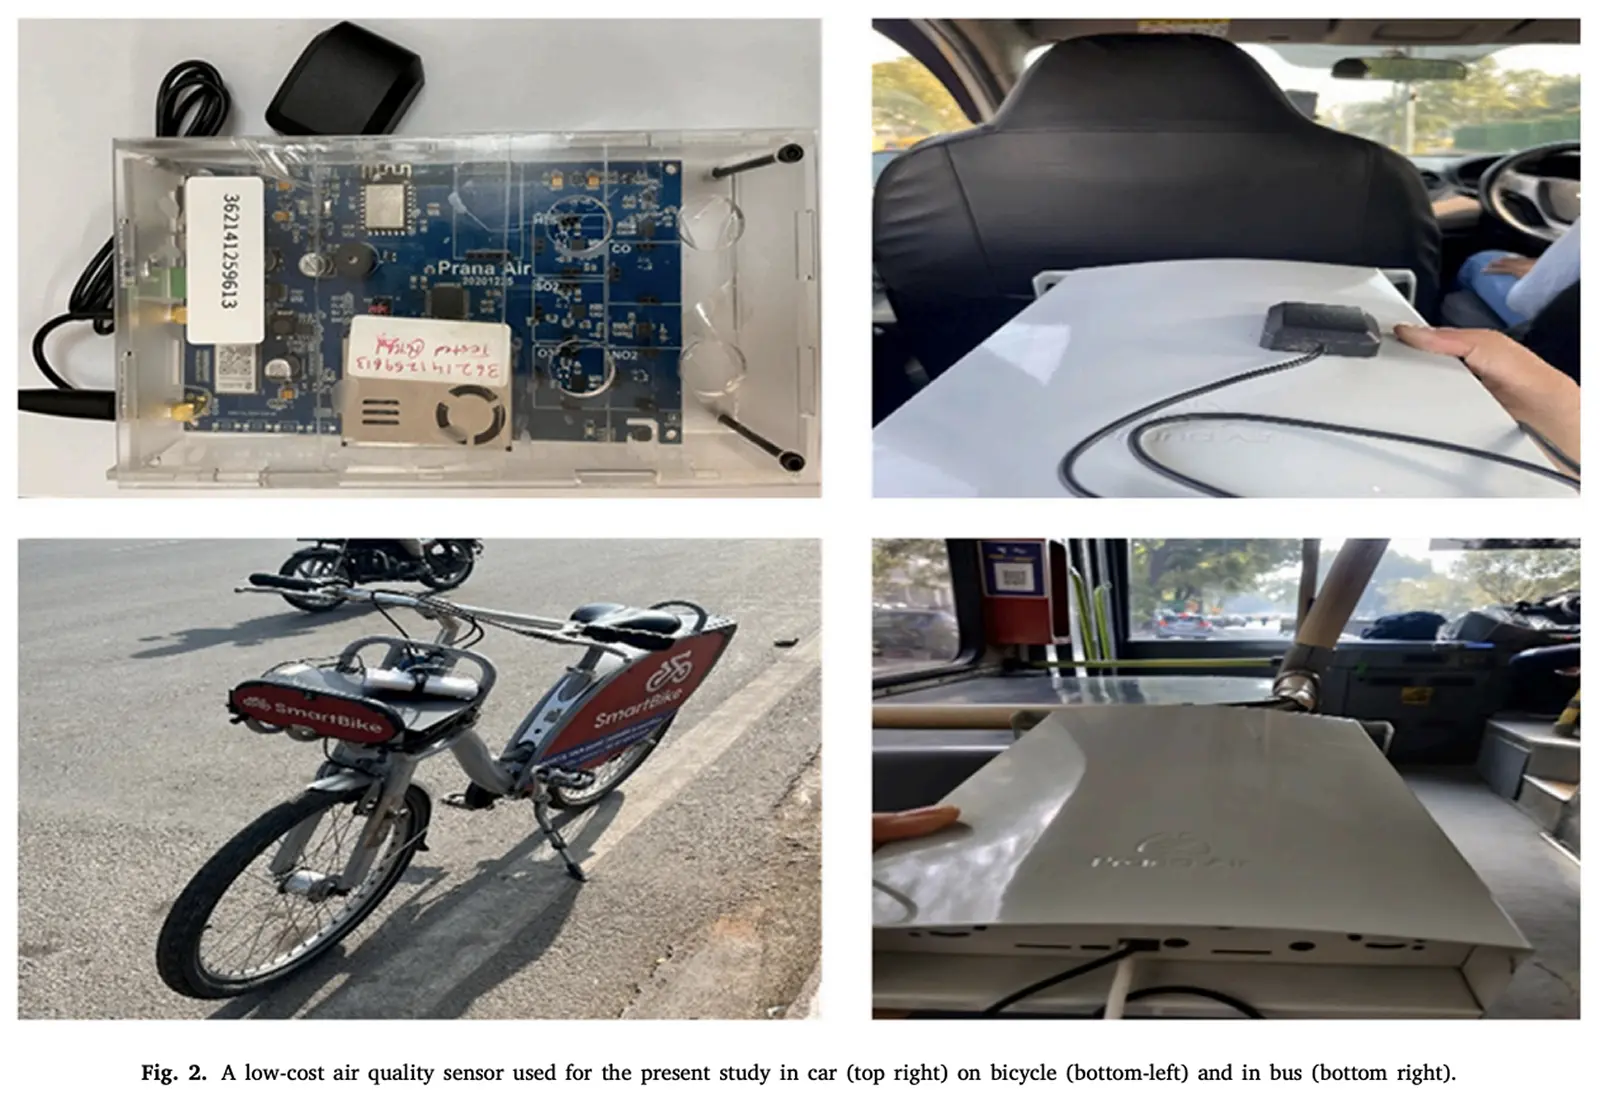
- Device Used: Prana Air Ambient PM Air Quality Monitors (with MS Housing)
- Monitored Parameters: PM2.5, PM10, PM1, Temperature, Humidity, GPS
- Duration: February 9–15, 2023
Introduction: Prana Air’s Air Quality Monitors in Different Modes of Transportation in Delhi
Making the air quality monitoring accessible from Urban Air is difficult. To make it possible, the IIT Roorkee’s Engineering department took the initiative and monitored the air quality levels as per the real-time personal exposure through the eight transport modes in Delhi in the microenvironments. So, the purpose of this research paper is to quantify variations in PM2.5 concentrations, regular doses, and spatial exposure levels to raise awareness and support policy interventions and health-risk mitigation.

In response to growing concerns about commuter exposure to fine particulate matter (PM2.5) in big cities, researchers from IIT Roorkee undertook a comprehensive study to evaluate real-time personal exposure levels across eight transport microenvironments in Delhi. The goal was to quantify variations in PM2.5 concentrations, inhalation doses, and temporal/spatial exposure levels to support policy interventions and health-risk mitigation.
Hence, to capture real-world air quality data on the move, the team needed accurate, portable, GPS- and GSM-enabled monitors that could function in diverse conditions, from open roads to crowded metro lines. Prana Air partnered with IIT Roorkee’s Civil Engineering Dept. to track transport pollution in Delhi by providing advanced air quality monitoring.
Problem Statement: Understanding Mode-Specific Exposure to Fine Particulate Pollution
Delhi, one of the world’s most polluted megacities, poses serious health risks to its residents, especially daily commuters exposed to fine particulate matter (PM2.5). Although fixed air quality monitoring stations provide general city-wide data, there is a lack of granular, real-time information on individual exposure during daily travel.
To address this gap, IIT Roorkee researchers aimed to:
- Monitor real-time PM2.5 and PM10 exposure inside different transport environments
- Correlate air quality data with GPS location for spatial analysis
- Use a portable, tamper-proof, rugged solution suitable for both open (e.g., bicycle, auto-rickshaw) and enclosed modes (e.g., AC bus/car)
- Ensure continuous data recording and transmission via GSM
- Provide high accuracy, validated against industry-grade instruments
This required a robust, portable solution that could maintain accuracy and connectivity across various environments.
Technology Deployed: Prana Air’s Portable, GSM-Enabled Ambient PM with GPS and MS Housing
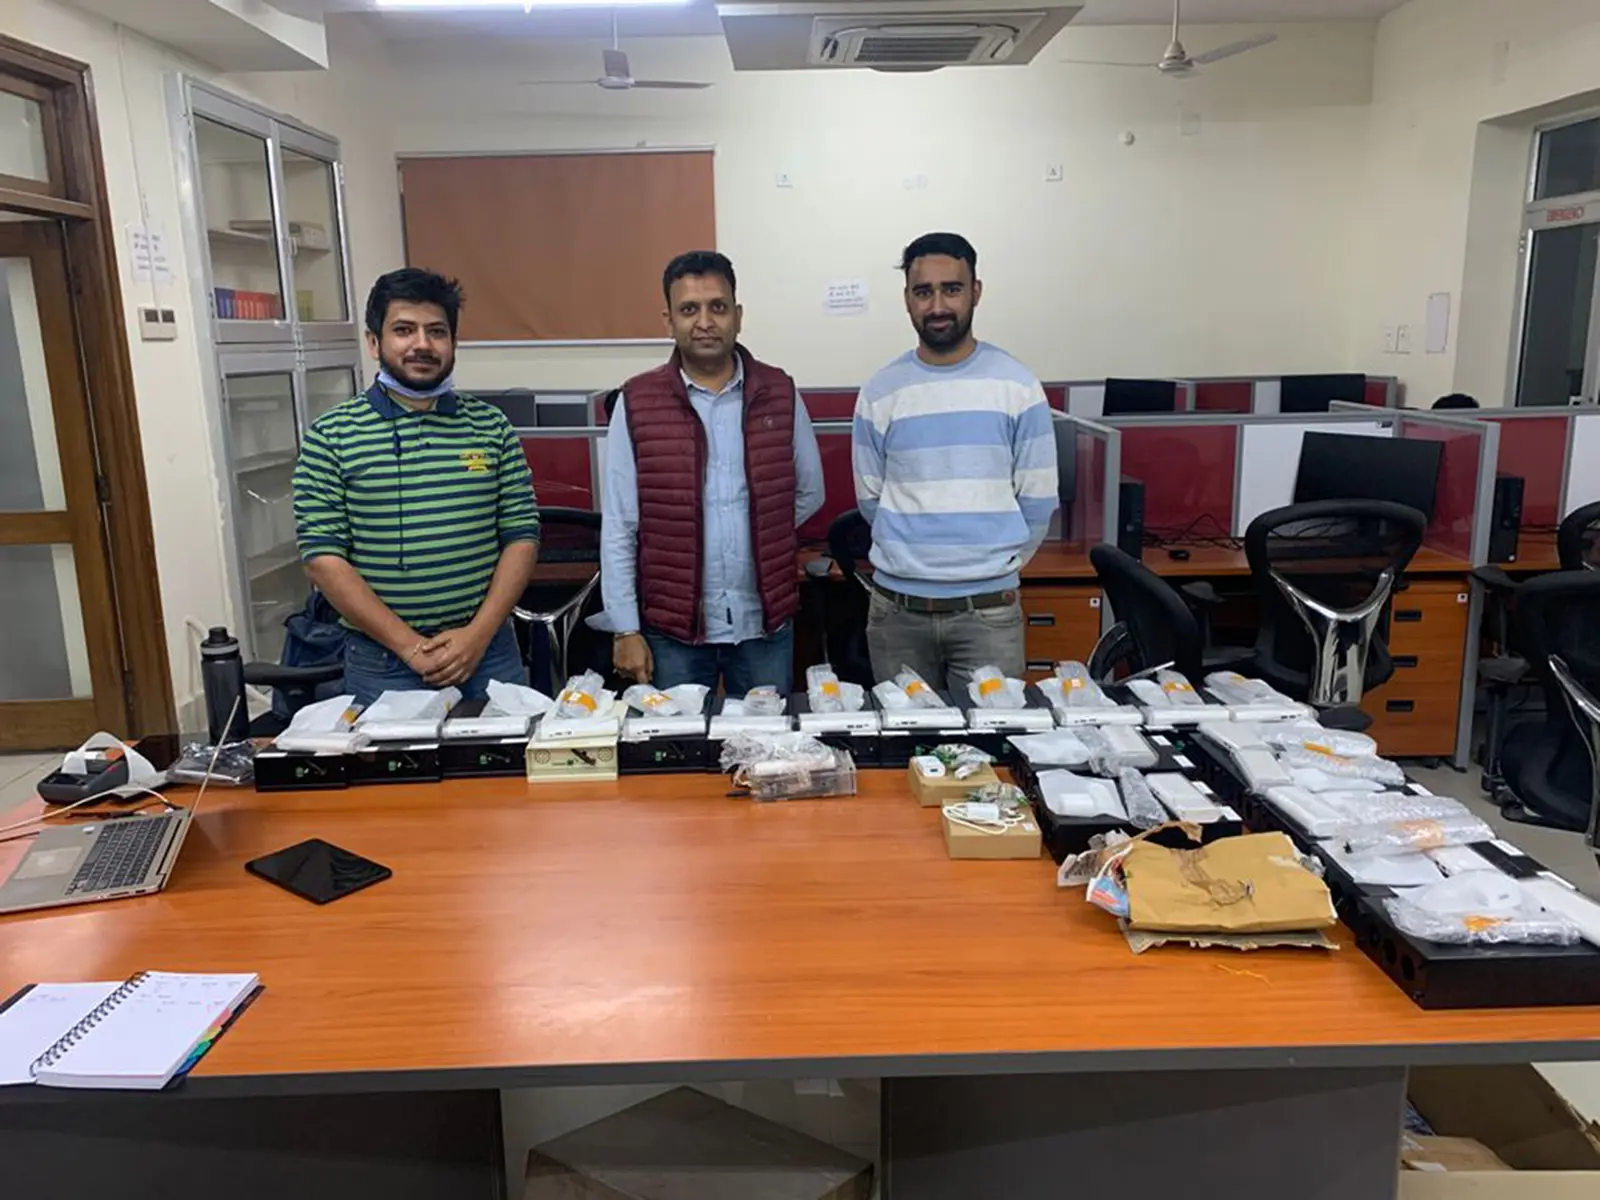
Prana Air supplied 25 Ambient PM Air Quality Monitors housed in rugged metal enclosures (MS Housing) to withstand the demands of mobile urban deployment. Here’s how Prana Air partnered with IIT Roorkee’s Civil Engineering Dept. to track transport pollution in Delhi.The devices have equipped with:
- Wi-Fi and GSM (2G/4G) capabilities, enabling continuous real-time data uploads
- NarrowBand IoT (NB-IoT) compatibility for low-power transmission
- Onboard GPS modules, ensuring location-tagged measurements
- Internal memory card storage for local logging every 10 seconds
- API connectivity for uploading readings every 1 minute to a centralized server
These capabilities allowed the researchers to simultaneously collect time-stamped PM data along with location, temperature, and humidity across all modes of transport.
Calibration Protocol: Validating Prana Air Devices Against DustTrak Reference Instruments
To ensure data reliability, Prana Air monitors underwent 7-day co-location calibration against a DustTrak Model 8530 reference device at Prana Air in Delhi. A specially designed calibration bench allowed up to ten sensors to be tested simultaneously.
Key outcomes from calibration included:
- Regression coefficient (R²): 0.994, showing very high accuracy
- Outdoor data comparison showed sensor readings were within ±10% of standard reference values
- Additional 8-day field validation further confirmed consistency
Data Collection Strategy: Monitoring Across 405 Commute Trips and Multiple Time Windows
The study took place between February 9 and 15, 2023, with data collected over three commuting periods daily: morning peak (08:00–11:00), afternoon off-peak (12:00–15:00), and evening peak (17:00–20:00).
Key details:
- 405 trips conducted over 7 days by 6 trained participants
- All modes covered: AC/Non-AC buses and cars, metro, MTW, bicycle, and auto-rickshaws
- Each trip lasted 40–60 minutes
- Real-time data was visualized using a mobile application, which also helped users monitor sensor performance
- Simultaneous trips using AC and non-AC variants conducted to enable comparative analysis
The sensors collected data every 3 seconds (locally) and 1 minute (online), allowing fine-grained analysis of air quality exposure in motion.
Spatial Mapping of Pollution: Identifying PM2.5 Hotspots Across Delhi Using GPS Data
Using location-tagged PM2.5 data, the study created exposure heatmaps of the full 8.5 km travel route between Connaught Place and AIIMS. These maps revealed clear pollution hotspots in specific areas:
- Connaught Place, a major commercial district with dense traffic
- Central Vista construction zone
- Dilli Haat market, AIIMS Cloverleaf, signalized intersections, bus stops, and roundabouts
Heatmaps showed the highest pollution exposure in open transport modes (bicycles and MTWs), which are directly exposed to roadside emissions. In contrast, AC modes showed lower spatial variability due to enclosed environments.
These findings demonstrate how spatial mapping can support data-driven decisions for urban planning and personal exposure avoidance.
Inhalation Dose Analysis: Quantifying PM2.5 Intake Per Mode and Minute
To better reflect the health implications, the study calculated the inhalation dose, the actual amount of PM2.5 inhaled, based on both trip duration and minute-by-minute exposure.
In addition to calculating inhalation doses, the study also analyzed average PM2.5 concentrations across all transport modes. The findings revealed clear differences in the air quality experienced by commuters depending on their mode of travel:
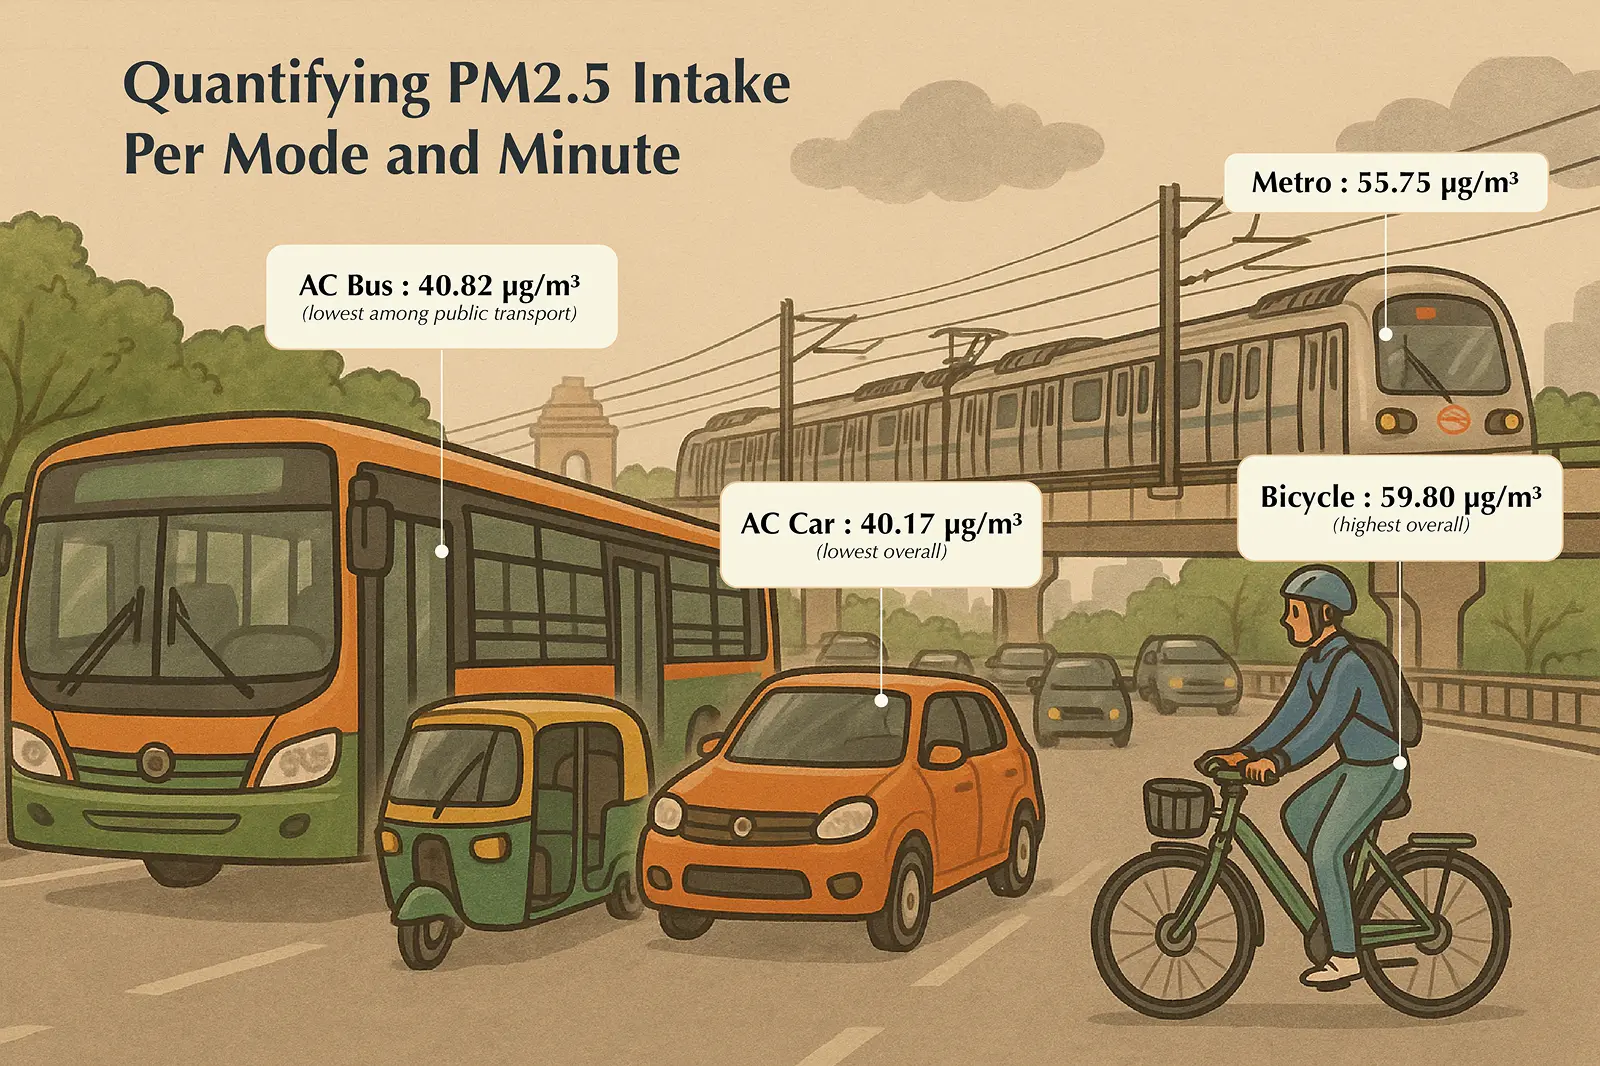
- Bicycle: 59.80 µg/m³ (highest)
- Metro: 55.75 µg/m³
- AC Bus: 40.82 µg/m³ (lowest among public transport)
- AC Car: 40.17 µg/m³ (lowest overall)
These results show that open and semi-enclosed modes like bicycles and metros are associated with significantly higher pollution levels. While air-conditioned, enclosed vehicles offer the cleanest environments.
Which Mode Exposes You the Most?
- Bicycles consistently had the highest pollution intake, both in total and per minute, because cyclists breathe faster and are directly exposed to vehicle emissions.
- AC buses had the lowest dose, thanks to filtered air and enclosed cabins.
- The metro, though showing high PM2.5 levels at times, had shorter travel time, so the total intake was lower than expected.
Full Ranking of Inhalation Dose by Mode:
For a full trip (most to least pollution inhaled):
Bicycle > Non-AC Bus > Non-AC Car > Motorbike > Auto-rickshaw > Metro > AC Car > AC Bus
Per minute of travel (most to least pollution inhaled):
Bicycle > Motorbike > Non-AC Bus > Non-AC Car > Metro > Auto-rickshaw > AC Car > AC Bus
Notable results:
- People commuting by cycle inhaled 4.68x more PM2.5 per minute than AC bus riders
- Metro trips had high concentrations but shorter durations, leading to a lower total inhaled dose
- Active modes, despite health benefits, were associated with higher pollutant intake, especially during peak traffic hours
This analysis provided a clearer picture of how exposure and time interact to affect actual health risks.
Conclusion: Prana Air’s Technology Powers Mobile Air Quality Research with Real-World Impact
The collaboration between IIT Roorkee and Prana Air demonstrated that low-cost, portable air quality sensors, when accurately calibrated and validated, can generate high-impact environmental health data at scale.
By enabling granular, real-time exposure monitoring across diverse transport environments, Prana Air’s technology empowered researchers to:
- Map individual-level air pollution exposure
- Identify urban pollution hotspots
- Analyze health risks using inhalation dose metrics
- Recommend actionable public health and infrastructure policies
This case study not only highlights the capabilities of Prana Air devices but also sets a new benchmark for evidence-based urban air quality planning in India and beyond.